Hey friends, Faizan Ali here! From my experience, I’ve learned one thing: behind every amazing mission, there’s a massive mountain of data. For non-profits, this info—volunteer hours, donations, program impact—can feel so heavy if not handled well. You’re pouring your heart out; the last thing you need is to drown in spreadsheets or be scared of complex software.
Gosh, I swear, there were times I’d just stare at those endless columns of numbers, my head spinning, utterly clueless how I’d ever explain anything to folks, let alone figure out if we were even making headway. Seriously, it felt like my brain just about broke. But then, an honest-to-goodness lightbulb moment hit, and that’s why I’m practically buzzing to share this lifesaver: an effortless Google Sheets dashboard, specifically for non-profits. We’re talking super simple, totally free. Basic formulas, my friend, and suddenly you’ve got this crystal-clear window into all your volunteer hours, your fundraising efforts—the whole shebang. Trust me on this one: you absolutely, 100%, have got this in the bag.
Why Your Non-Profit Needs a Simple Data Dashboard
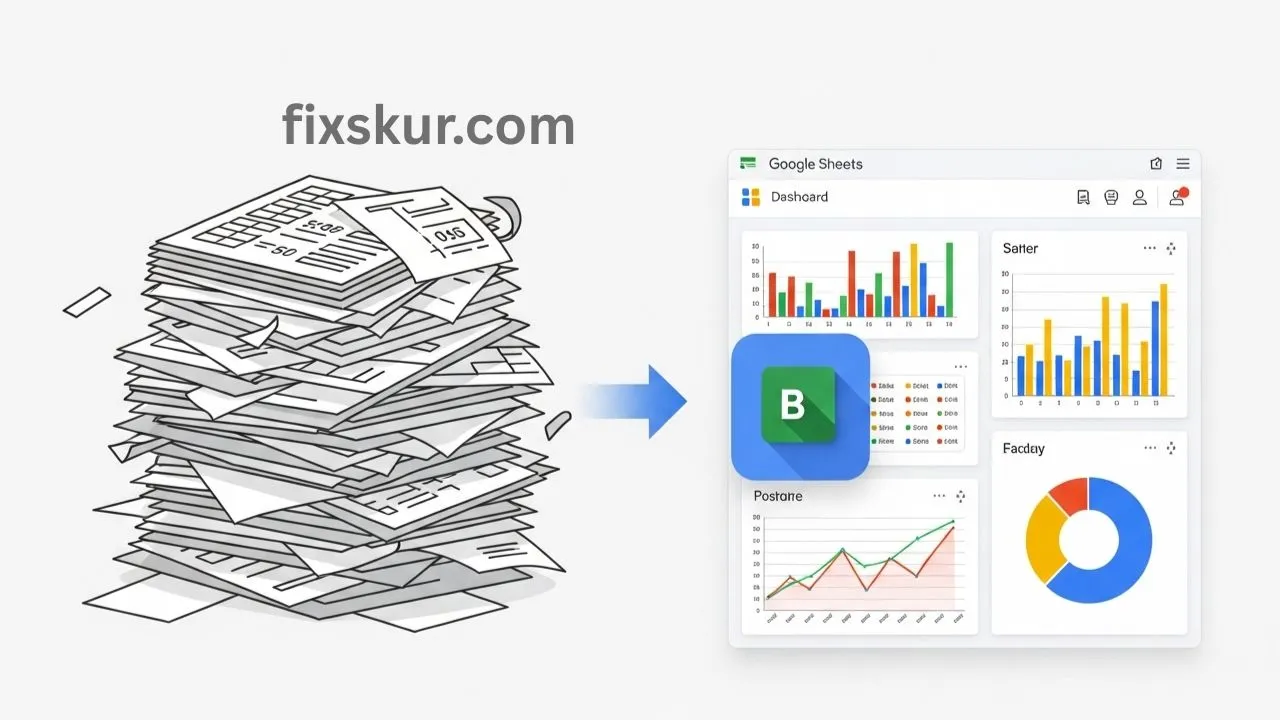
I recall a time when I was attempting to manage data myself and everything seemed very messy. Stacks of spreadsheets were present, each one contained a piece of the puzzle, but a full picture never emerged. This was quite frustrating, and honestly, a bit demotivating as well. This struggle is not only mine, many non-profits also encounter this issue when they have limited resources, a small budget, and a lack of tech skills needed to make data-driven decisions.
Benefits of a Google Sheets Dashboard
But here’s the good news: a good dashboard can change everything. This doesn’t mean that you’ll have to become a “spreadsheet wizard” (although after a while you might feel like you’ve become one!). The real purpose is to provide clarity to your mission. A dashboard gives you a clear, real-time view of your operations, so you can monitor progress and easily identify areas for improvement. Consider this:
- See the Impact: How many hours did the volunteers contribute in the last month? How much donation revenue came in this quarter?
- Easier Reporting: In grant applications, specific metrics are always asked for. If that data is ready, then you would avoid the dreadful hours of panic searching.
- Better Decision-Making: You will be able to see and understand trends, determine which campaign is working, and allocate your resources efficiently.
- Boost Team Motivation: When everyone can see the collective effort and progress, it extremely enhances the energy and sense of achievement.
A Google Sheets Dashboard becomes something like a control center for non-profits – where you can easily manage your data, make good use of resources, and also increase transparency.
Your Toolkit: Essential Google Sheets Formulas for Non-Profits
“Formulas”? Ugh, yeah, I used to cringe at that word. But honestly, they’re not some scary monster under the bed; they’re actually just clever little instructions that turn Google Sheets into your personal data-crunching sidekick. Seriously, think of ’em like tiny, super-efficient elves that’ll count, add, and sort everything for you. Both Google Sheets (and Excel, too!) are, like, total budget-friendly champs for keeping tabs on your data using these magical bits, plus filters and a little conditional formatting flair.
Key Formulas for Tracking Volunteer Hours and Donations
So, here are the real superstars we’ll be playing with:
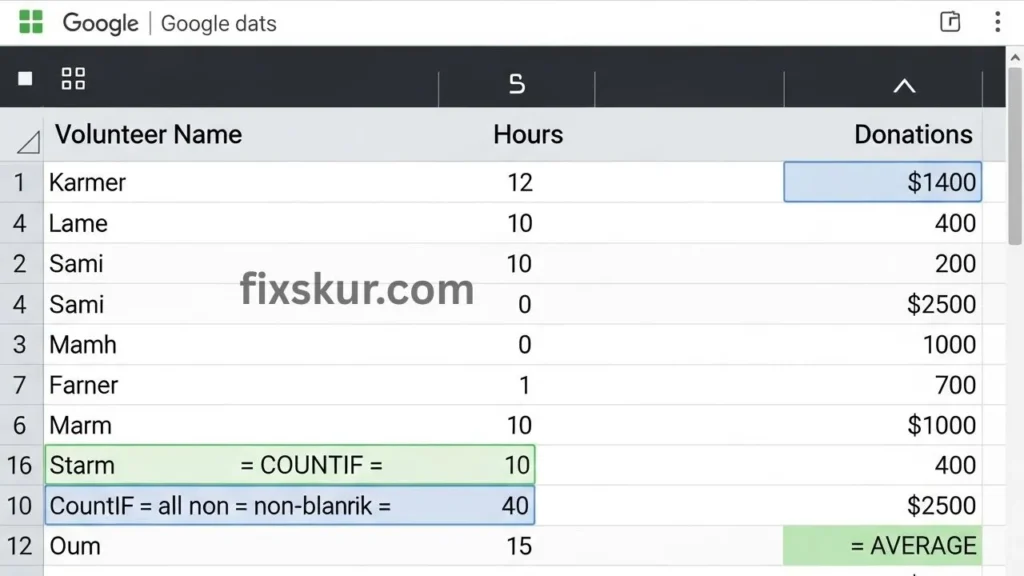
COUNTIF/COUNTIFS: Tallying Volunteer Shifts and Specific Activities
These formulas? Oh man, they’re your absolute go-to for just counting how often something pops up. Like, wanna quickly know how many volunteers showed for your last event? Or, get this: how many different people actually came back to volunteer repeatedly? Bang! COUNTIF is your secret weapon.
=COUNTIF(range, "criteria")
=COUNTIFS(criteria_range1, criteria1, criteria_range2, criteria2, ...)
Practical Tip: I still remember how COUNTIF let me instantly check sign-ups for our weekend soup kitchen, which seriously helped us nail down supplies. Got an “Activity” column? COUNTIFS will even tell you how many volunteers crushed “Food Prep” and “Distribution” on the same day. So slick!
SUMIF/SUMIFS: Tallying Up Donations by Campaign or Donor
Alright, so when you’ve gotta add numbers but only if they meet certain conditions? SUMIF is your absolute go-to. Seriously, it’s a total lifesaver for tracking all your financial goodies, like those incoming donations.
=SUMIF(range, "criteria", sum_range)
=SUMIFS(sum_range, criteria_range1, criteria1, ...)
Practical Tip: Wanna know how much dough your “Winter Appeal” campaign actually pulled in? SUMIF gets the job done. But if you’re like me and need to drill down, maybe just for the “individual donors” for that same campaign? SUMIFS makes it a total no-brainer. Gives you an instant pulse on fundraising and makes reporting a breeze.
AVERAGE: Spotting Trends (like average donation size)
This one’s deceptively simple, but boy, does AVERAGE pack a punch! It’ll just show you the typical value, which, over time, helps you see clear as day where things are heading.
=AVERAGE(range)
Practical Tip: Ever wonder if your latest event was a financial home run? Crunching the average donation after that shindig will tell you in a flash, helping you plan even smarter for next time.
IF Statements: Little Logic Bombs for Status Updates
IF statements? Think of them as setting up basic “if-then” rules. You know, “If this is true, then do X; otherwise, do Y.” Simple as that.
=IF(logical_expression, value_if_true, value_if_false)
Practical Tip: I once slapped an IF statement into a “Donation Status” column, like =IF(C2>0, “Received”, “Pending”) (C2 being the amount). Total game-changer for a quick visual!
Data Validation & Drop-downs: Keeping Your Data Spotless
Okay, this isn’t a formula, but holy smokes, it’s a total game-changer! Data validation? It’s like a little digital bouncer, stopping errors cold and keeping your data super uniform.
Practical Tip: You can whip up drop-down lists for all your common entries – stuff like “Volunteer Role” (“Event Setup,” “Registration,” “Clean Up”) or “Donation Campaign” (“Annual Fund,” “Capital Campaign”). Keeps your data tidy and ensures your formulas actually work right.
Build Your Google Sheets Dashboard for Non-Profits: Step-by-Step Guide
Step 1: Laying the Groundwork – Setting Up Your Data Entry Tabs
Okay, let’s actually start building out our dashboard, shall we? Seriously, keep it simple and super practical. You absolutely don’t need some fancy-schmancy software; Google Sheets is totally up to the task.
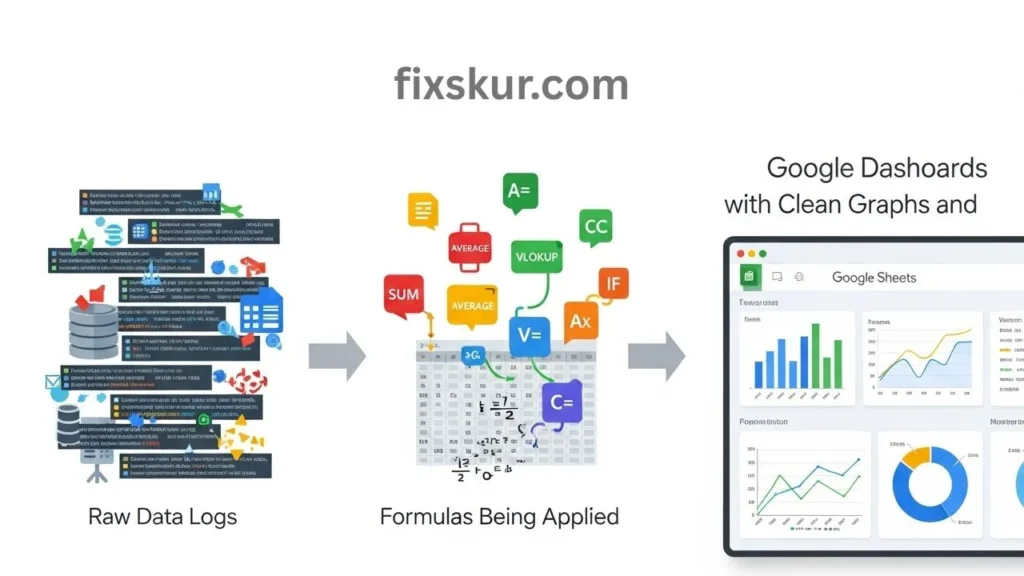
Think of these as your raw, behind-the-scenes data logs. We’ll have one just for volunteers, and another for all those generous donations. So, fire up a fresh Google Sheet, then whip up two new tabs down below. Go ahead and label one “Volunteer Log” and the other “Donation Log.”
For your “Volunteer Log” tab, you’ll want to set up these columns:
- Date: (When they actually put in the hours)
- Volunteer Name
- Activity/Role: (Stuff like “Event Setup,” “Mentoring,” “Admin Support”)
- Hours Contributed
- Project/Event: (Which specific gig or event they helped with)
- Notes: (Any extra tidbits you need to remember)
Now, over on your “Donation Log” tab, we’ll need these specific columns:
- Date: (When that generous gift landed)
- Donor Name
- Amount
- Campaign/Fund: (Like “Annual Appeal,” “Building Fund”)
- Payment Method: (e.g., “Online,” “Check,” “Cash”)
- Notes: (Maybe “First-time donor,” or “Matching gift eligible” – you get the drift!)
Faizan’s Insight: Okay, total confession time: I used to try stuffing everything onto one giant sheet. Big mistake, folks! Trust me, splitting your data into these neat, logical tabs makes it a million times easier to manage, understand, and use for your dashboard later. Plus, data entry just feels way less stressful for everyone.
Step 2: Crafting Your Dashboard Tab – Where All the Magic Happens!
Next up, create a third tab, and let’s name it “Dashboard.” This is where all those awesome insights are gonna live, plain as day. To keep things looking slick and organized, use some clear headers and merged cells.
Okay, so here’s a little visual to get you started on a possible layout:
- A1: NON-PROFIT IMPACT OVERVIEW (merge A1:D1, bold and larger font)
- Volunteer Metrics: (A3)
- Total Volunteers: (B4)
- Total Volunteer Hours: (B5)
- Average Hours/Volunteer: (B6)
- Volunteers for [Specific Event, e.g., “Spring Gala”]: (B7)
- Donation Metrics: (A9)
- Total Donations Received: (B10)
- Total Funds Raised: (B11)
- Average Donation Amount: (B12)
- Donations for [Specific Campaign, e.g., “Youth Program”]: (B13)
Step 3: Connecting the Dots with Formulas
- Total Volunteers (B4):
=COUNT(UNIQUE(‘Volunteer Log’!B:B))
(This neat little trick actually counts all the individual names in your Volunteer Log, column B. Pretty clever, right?)
- Total Volunteer Hours (B5):
=SUM(‘Volunteer Log’!D:D)
(Just tallies up every single hour from column D in your Volunteer Log. Couldn’t be easier!)
- Average Hours/Volunteer (B6):
=B5/B4
(Basically, it takes those total hours and simply divides ’em by your total volunteers. Boom! Simple math!)
- Volunteers for “Spring Gala” (B7):
=COUNTIF(‘Volunteer Log’!E:E, “Spring Gala”)
(Counts how many times “Spring Gala” pops up in that Project/Event column, no fuss!)
- Total Donations Received (B10):
=COUNT(‘Donation Log’!C:C)
(Counts every single entry in your Donation Log’s Amount column. Boom.)
- Total Funds Raised (B11):
=SUM(‘Donation Log’!C:C)
(It just adds up every single penny from your Donation Log’s column C. Cha-ching!)
- Average Donation Amount (B12):
=B11/B10
(Totally, it’s just total funds divided by total donations. Keeping it real, you know?)
- Donations for “Youth Program” (B13):
=SUMIF(‘Donation Log’!D:D, “Youth Program”, ‘Donation Log’!C:C)
(This clever trick sums amounts from column C, but only for rows where “Youth Program” is hanging out in column D. Pretty slick, huh?)
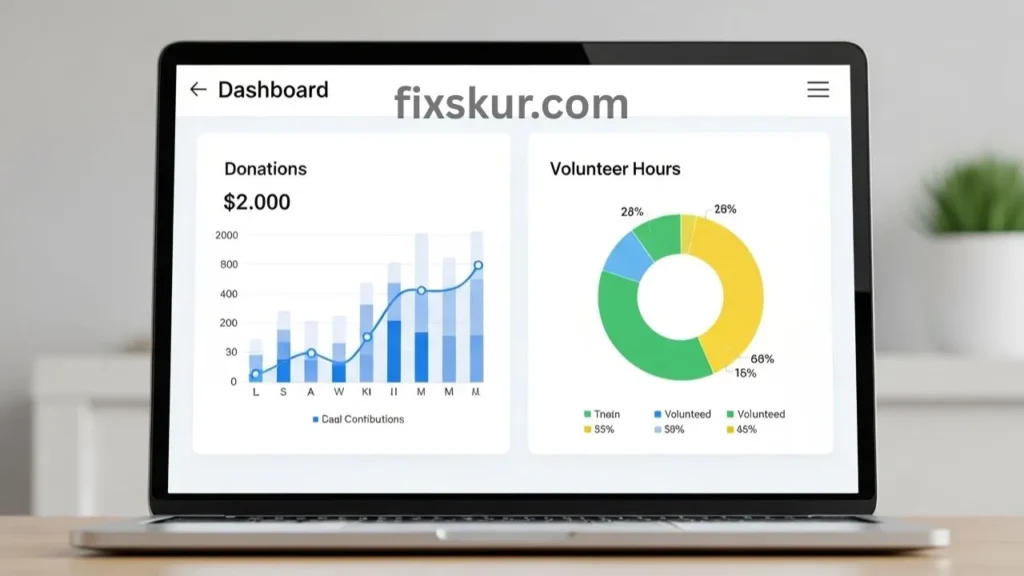
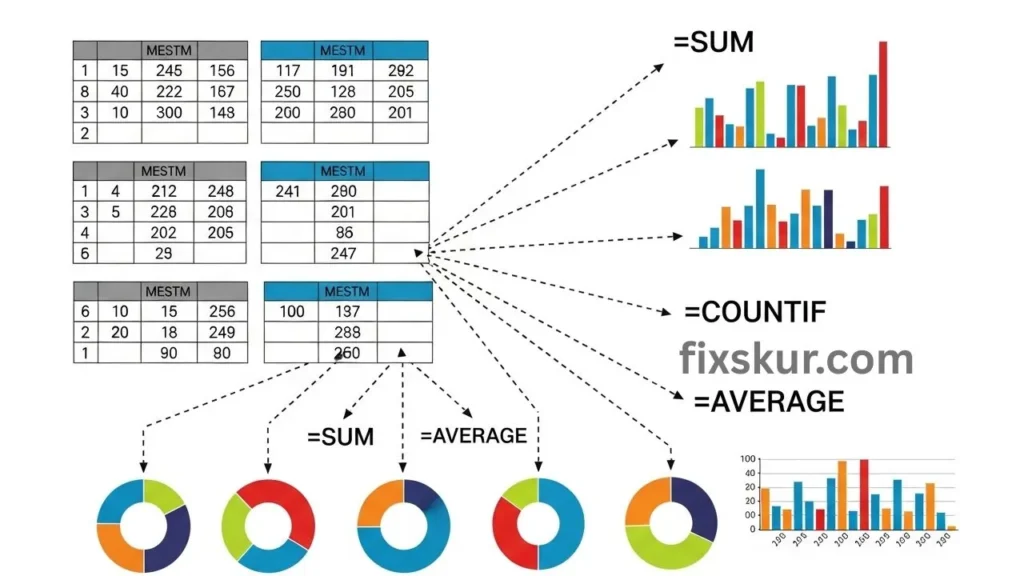
Faizan’s Pro-Tip on Visuals: Look, let’s just be totally honest: numbers by themselves? They’re good, sure, but they really jump off the page when you toss ’em into a chart! And Google Sheets, my friends, makes this whole thing practically foolproof. Just pick your data (like, say, a few donation campaigns and their totals), hit Insert > Chart, and bam! Your raw info suddenly makes sense, becoming these vibrant, easy-to-digest pictures. Bar charts are my go-to for comparing stuff, while pie charts are absolute winners for showing percentages, especially for those crucial non-profit reports.
Real-Life Impact of Your Non-Profit Dashboard
You might be thinking, “All this is fine, but what’s the real difference?” Trust me, the difference is huge. A simple Google Sheets Dashboard is not just for displaying numbers, it actually empowers your team and makes your mission even more powerful.
Key Benefits for Non-Profits
- Grant Reporting & Funding Made Easy: Foundations always need proof of the impact of your work. When you have readily available data such as volunteer hours (valued at an average of $31 per hour!), total donors, and funds raised – grant applications become easy and compelling. This transparency attracts more funding and support.
- Better Communication With Donors: When a donor asks, “What difference did my contribution make?”, You can just show them! Point to specific numbers for the program they backed—that really builds trust and makes donors feel part of something. And hey, let’s talk about motivating volunteers: they’re the heart and soul of non-profits. When you highlight their collective impact—total hours, projects crushed, lives touched—they truly see their worth and stick around for the long haul.
- Smarter Decision-Making: If your latest fundraising campaign is running slow, the dashboard will immediately show it. You can change your strategy on time. If certain volunteer activities are always understaffed, that will also be clearly visible. Such insight improves the ROI of your programs.
- Streamlining Operations: When the search for data is reduced, you can spend more time on your primary mission. The idea is not to work hard, but smart – boosting efficiency.
Pro-Tips from Faizan Ali for Non-Profit Dashboards
- Start Simple, Then Grow: Everything doesn’t need to be tracked from day one. Start with tracking volunteer hours and donations, then gradually add complex metrics. Google Forms is an excellent tool to start.
- After Grating: Volunteers can directly sign-in on the sheet.
- Regular Data Entry: A dashboard is only as useful as the accurate data in it. Just get your team to consistently input that data, by the way.
- Experiment: Google Sheets is super forgiving, trust me! Mess around with formulas, charts, or cool conditional formatting. Not working? Just hit undo, no sweat.
- Share & Collaborate: Best thing about Sheets? It’s built for teamwork. So, share that dashboard! Everyone sees real-time data, everyone stays in sync. Simple.
- Celebrate Small Wins: When you effortlessly whip up a report or instantly answer a stakeholder’s question thanks to this dashboard, take a second. Seriously. Those little victories? Pure rocket fuel for bigger results.
Conclusion: Empower Your Non-Profit with Data
You started this journey with a big heart and mission. Now, you’ve got the power of beautifully organized data, right there at your fingertips. It’s your Google Sheets dashboard. Look, this isn’t just numbers, folks—it’s your story, your impact, and the smart moves that truly push your mission ahead. So, take a deep breath, crack open Google Sheets, and get building that dashboard! Your non-profit, your volunteers, and those for whom you are working – everyone will thank you.
Ready to transform your data? Create your Google Sheets dashboard today and share your success moments!
Discover more helpful posts below:
- The Best No-Code Tools for Automating Small Business Workflows
- Google Sheets Personal Finance: Master Your Money with a Smart Workflow
- Unlock Your Superpower: Master Your Smart Multi-Monitor Workflow!